In 2013, I had authored/published a paper that had tried to define a formula for user acquisition.
The variables considered in that equation were meant to be measurable and to provide higher education marketers with a starting point of strategy building.
Over the next 2 years, this formula was implemented across some successful local business schools in India wherein we saw a significant jump in application numbers. We followed the basics of this model and helped these business schools to uncover significant delta over a period of 1-2 years.
Like all frameworks, there ought to be continuous work to refine such an equation, and I have attempted to do the same and this article is for me to share my thoughts on this subject. You can be the judge of whether this makes sense, and how we ought to look at implementing this scaled up model to business school’s global marketing strategies. So the questions I started asking myself were in the lines of – how to decide which markets to go after to promote a business school or its programs, OR how to decide which programs would make sense in specific markets?
As a part of the framework, I had suggested the following formula:


Sum(i) = Overall demand for international programs
Sum(d) = population that can be considered as the right fit for such programs
Sum(Q) = Population in that country/region interested in tertiary education
Sum(R) = Proportion of household income allocated to higher education
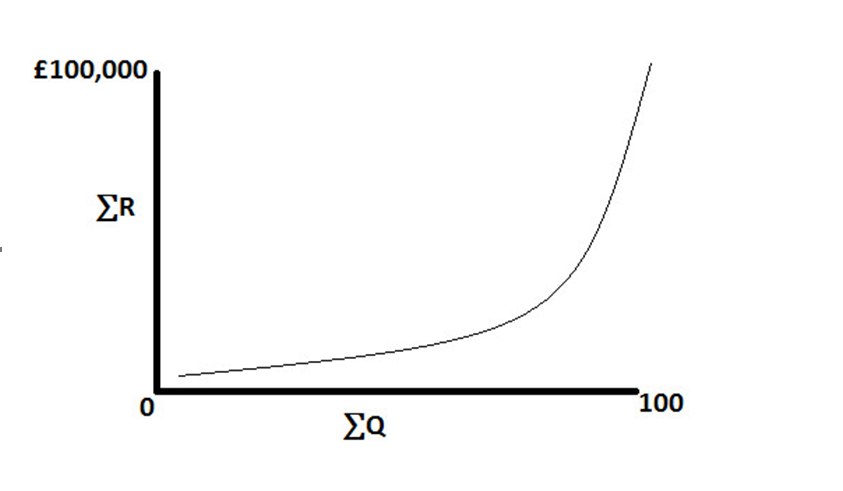
The relations between two of these factors ∑Q and ∑R is intriguing and defines how we ought to approach user acquisition from a certain market/country/region. As one digs deeper into the data, it is quite evident that the distribution of the proportion of household income allocated for higher education against the population interested in tertiary education gives a Lorenz curve that would look something like this:


The location factor, in this case, is a positive range that can be used to structure the overall score of ∑R into a predictable pattern
The Q-R Graph, therefore, tells us that while due to the ambition of general inquiry, the total population excited to be a part of international programs may be huge, the ∑R defines the capability of that population to actually enroll for a particular program or a set of programs.
To further accurately estimate the user acquisition from a certain market, I will bring in another factor called as “acceptance factor” which is defined by the acceptance of a certain type of program or an institution in that particular region in terms of employability. Let us call this factor as “alpha”
The acceptance factor should have a range of 1-9, wherein 1 is highest and 9 is the lowest in the range. This factor will be a function of – number of employers in a country accepting a candidate with this degree/institution, the number of alternatives available locally, and the number of jobs that open up because of this degree. This is a critical component.
So now this means that the initial equation will take the shape of:![]()

So the data you would need to collect while making a marketing strategy for your business school would be very different than what you are collecting at present. This also changes the way you measure marketing outcomes. I personally have reasons to believe that you would be able to replicate this locally as well as globally, given that these factors would kind of remain the same.
Also, you can create a retargeting strategy for audiences that engage with your full-time admission teams, but may also be relevant to other programs in a given life cycle. It is pertinent for you to be able to define them into the correct silos from the beginning, and not scoff at bad data for your full time from a certain region and discard them.
This is, however, just the beginning of the framework and one can keep adding more dimensions and use cases that will change the way we look at business school marketing work. We need to stop relying on historical data, random market trends, and unstructured data that add up to spoiling marketing dollars every year. Measurement at the end of an experiment is not a scientific way to go ahead, and one would need to look at the right ingredients that will go into this strategy.
 Simply put, the equation meant that user acquisition is a product of intent, demographics, demand, and purchasing power. It is pretty straightforward to understand.


